
Calculation of the make-up water consumption for the water-cooling (circulation) circuit of a wet cooling tower
Ivan Tikhonov
Make-up water consumption for a wet cooling tower is determined by the makeup water chemistry.
Heat removal in a wet cooling tower occurs due to the evaporation of a part of the water in the cooling tower. As a result of the evaporation, heat is removed from the cooling water. This process is highly efficient in terms of heat transfer. But what happens to the chemical water composition in a wet cooling tower?
The following process takes place. As a result of the contact of drops or a film of water flowing down the cooling tower with air driven through the cooling tower, carbon dioxide is removed from the water. The air contains about 0.4-0.5 mg/l (ppm) of carbon dioxide. Accordingly, in the process of such contact, carbon dioxide equilibrium is achieved between air and water. For the vast majority of surface water and groundwater, a carbon dioxide value in them equals 0.5 mg/l that will correspond to a pH value above 8.0. Therefore, for efficiently operating wet cooling towers, the water pH of the cooling tower circuit should be above 8.0. For hydrocarbonate waters, the pH value will increase to 8.5. Moreover, if the pH value of the water in the cooling tower circuit is below 8.0, it means that the process of water evaporation and, accordingly, heat removal is not efficient enough, and the cooling tower does not provide high efficiency of the water cooling process. This does not apply to cooling towers where acid is dosed into the circuit.
As a result the following situation occures. Even with insignificant concentrations of calcium and bicarbonate, the water of the cooling tower circuit will tend to deposit calcium carbonate, because carbon dioxide maintaining carbon dioxide equilibrium in the make-up (feed) water cannot provide this equilibrium in the circuit (because it is distilled off in the cooling tower with air). In fact, this suggests that in 99% of the cases, solid calcium carbonate will be released in the circuit of the water-cooling device. This situation is aggravated by the fact that the pH value of the water in the circuit is too low (8.0-8.5) to ensure the release of calcium carbonate into the sludge. This requires a pH value of more than 11.0. Therefore, almost all calcium carbonate will be evenly deposited on pipelines, heat exchange equipment and, to a greater extent, on the cooling tower sprinkler.
This situation is solved by the fact that most cooling tower manufacturers indicate that the Langelier index should be no more than 1.0. In this case, it is possible to use salt formation inhibitors. In any case, with such a value of the saturation index, it is possible to work quite efficiently with periodic acid washings of the heat exchange equipment. When choosing equipment, it is important to take into account at least 10% thermal power reserve of the cooling tower and heat exchangers.
The second important indicator of the water quality of a cooling tower circuit is TDS or salinity or mineral residue. Formally, these indicators are slightly different, but for a cooling tower, they can be taken to be the same in meaning. This parameter is set by the manufacturers of cooling towers at about 2100 ppm. This parameter indicates how many times the water in the cooling tower can be evaporated.
It turns out, for example, that if the salinity of the source water is 400 ppm, then the evaporation ratio in the cooling tower circuit will be 2100/400 = 5.25. The salinity of the cooling tower circuit water will increase 5.25 times compared to the make-up water. Accordingly, the concentration of each ion will increase fivefold. Thus, make-up water must be prepared in such a way that an increase in ion concentration does not lead to active precipitation of calcium carbonate in the cooling tower circuit.
Now I have written quite obvious things in order to bring you to one very interesting conclusion – at what chemical composition of the source water the reverse osmosis desalination of the make-up water for the cooling tower becomes profitable and even necessary. The fact is that during reverse osmosis desalination of water, a fairly large amount of waste water is formed. In fact, if the cooling tower circuit is fed directly (without reverse osmosis), the same water is discharged into the sewer, only directly from the cooling tower.
Nevertheless, reverse osmosis offers the advantage due to which the circulation rate in the cooling tower circuit can reach sufficiently large values. Therefore, the discharge of water from the cooling tower, when using reverse osmosis, will be minimal. In this case, the reagents for sludge control will be spent only in the reverse osmosis unit. Consequently, another advantage is that reverse osmosis requires fewer reagents to control sludge formation (all other things being equal) than when reagents are used directly in the cooling tower circulation.
Is it better to deminerate the water in front of the cooling tower or dump more water from the cooling tower?
Figure 1 shows a diagram of the operation of a wet cooling tower.
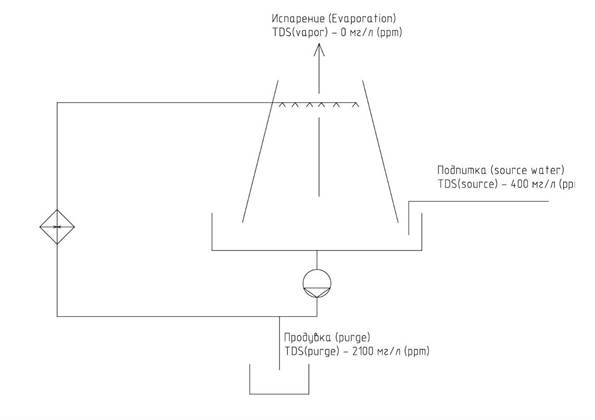
Figure 1.
Source (make up) water with a salinity (TDS) of 400 ppm enters the cooling tower bowl. The water from the cooling tower bowl is heated in a heat exchanger and fed to the cooling tower for irrigation. As a result of irrigation, part of the water evaporates and heat is removed from the water. To recover the evaporated water, the cooling tower is fed with source water. Obviously, the condensate of the evaporated water will have a salinity close to zero. Accordingly, salts will accumulate in the cooling tower, because the make-up water salinity is not zero. Let us set the limit for the salinity of water in the cooling tower circuit or purge water equaling to 2100 ppm. Let’s compose the material balance of the cooling tower in terms of salinity per 1 ton of evaporated water. We get,
(X+1) * TDS(source)= X * TDS(purge) + 1 * TDS(vapor)
where,
1 – one ton of water evaporated in the cooling tower, t.
Х – flow rate (fraction) of blowdown water obtained during the evaporation of 1 ton of water in the cooling tower to maintain the specified salinity of the cooling tower circuit, t.
TDS(source) – salt content of source (make-up) water, ppm.
TDS(purge) – salt content of purge water, ppm.
TDS(vapor) = 0 – salinity of cooling tower vapor condensate, ppm.
As a result of the transformation, we obtain,
Using this formula, we calculate the make-up water consumption, provided that the salinity of the source water is 400 ppm and the salinity of the purge water is 2100 ppm.
We get,
Х=400/(2100-400) = 0,235 or 0,235*100% = 23,5 %.
It turns out that we have to discharge 235 liters of water, or 23.5% of one ton, per 1 ton of vapor.
As a result, the consumption of make-up (source) water will be equal to
Х+1 = 0,235+1=1,235 t.
As we can see, if in this case a preliminary reverse osmosis desalination of the source water is used, then, since the consumption of osmosis concentrate will be about 30% of the source water, the consumption of makeup water, taking into account osmosis, will be 1.3 tons.
In this case, no water saving is observed. And this is despite the fact that even if the cooling tower is fed with osmotic water, the circulation ratio can hardly be made higher than 10. That is, in any case, for 1 ton of vapor, 100 kg of the purge will need to be drained.
Table 1 shows the calculation of the source water consumption depending on the salinity of the source water.
As the initial data, it was assumed that 10 t/h (Vvapor) of water evaporates in the cooling tower. The thermal power of such a cooling tower is about Q = 6 MW. For each salinity of the source water, the percentage of blowdown was calculated depending on the evaporation of 10 t/h of water in the cooling tower (X). Provided that the blowdown in the cooling tower cannot be less than 10%, the “X (real)” column represents the actual percentage of blowdown. Then the theoretical and real flow rates of the purge water were calculated (Vpurge; Vpurge (real)) as well as the theoretical and real make-up flow (Vsource; Vsource (real)). The last column shows the savings or cost overruns in cooling tower water consumption when reverse osmosis is used to treat the water in front of the cooling tower. It is assumed that the consumption of the concentrate from osmosis will be 30% of the consumption of the source water.
Table 1
| TDS(source) | TDS(purge) | X | X (real) | Q | V vapor | V purge | V purge (real) | V source | V source (real) | Saving/overspeding |
| ppm | ppm | % | % | MW | t/h | t/h | t/h | t/h | t/h | t/h |
| 20 | 2100 | 0,962 | 10 | 6,11 | 10 | 0,096154 | 1 | 10,09615 | 11 | -4,7 |
| 50 | 2100 | 2,439 | 10 | 6,11 | 10 | 0,243902 | 1 | 10,2439 | 11 | -4,7 |
| 100 | 2100 | 5 | 10 | 6,11 | 10 | 0,5 | 1 | 10,5 | 11 | -4,7 |
| 200 | 2100 | 10,53 | 10,52 | 6,11 | 10 | 1,052632 | 1,052 | 11,05263 | 11,052 | -4,648 |
| 400 | 2100 | 23,53 | 23,53 | 6,11 | 10 | 2,352941 | 2,353 | 12,35294 | 12,353 | -3,347 |
| 600 | 2100 | 40 | 40 | 6,11 | 10 | 4 | 4 | 14 | 14 | -1,7 |
| 800 | 2100 | 61,54 | 61,53 | 6,11 | 10 | 6,153846 | 6,153 | 16,15385 | 16,153 | 0,453 |
| 1000 | 2100 | 90,91 | 90,9 | 6,11 | 10 | 9,090909 | 9,09 | 19,09091 | 19,09 | 3,39 |
| 1200 | 2100 | 133,3 | 133,33 | 6,11 | 10 | 13,33333 | 13,333 | 23,33333 | 23,333 | 7,633 |
| 1400 | 2100 | 200 | 200 | 6,11 | 10 | 20 | 20 | 30 | 30 | 14,3 |
| 1600 | 2100 | 320 | 320 | 6,11 | 10 | 32 | 32 | 42 | 42 | 26,3 |
| 1800 | 2100 | 600 | 600 | 6,11 | 10 | 60 | 60 | 70 | 70 | 54,3 |
| 2000 | 2100 | 2000 | 2000 | 6,11 | 10 | 200 | 200 | 210 | 210 | 194,3 |
Figure 2 shows the graphs of the source water consumption and the saving/overspending of water depending on the salt content of the source water.
As we can see, up to the salt content of the source water equaling 750 ppm, in the case of using reverse osmosis, there will be only an overrun of water for the cooling tower. At a salt content higher than 750 ppm, water savings begin to appear. And with a salt content of about 1000 ppm, the savings when using reverse osmosis will be about 3.5 t/h (for a cooling tower Q = 6.0 MW). Depending on the cost of the source water plus the cost of the waste water disposal, as well as the number of hours of equipment operation per year, a significant amount of funds “poured into the pipe” can be obtained. In this case, the use of reverse osmosis, depending on the cost of water and the number of hours of operation, may be justified. It is also necessary to take into account that it is easier to control the process of sludge formation in reverse osmosis than in the cooling tower circuit. Moreover, a much higher concentration of reagents and, accordingly, the consumption of reagents will be required in the cooling tower circuit, since Langelier index in the circuit is significantly higher than in the concentrate line in a reverse osmosis unit.
Figure 2
When the salt content of the source water is 1500 ppm, the use of reverse osmosis is simply a necessity dictated by common sense.
with respect
Ivan Tikhonov
06.06.2021 г.

Hi Ivan
Interesting results. Have you considered Ozone. It would eliminate most of the chemicals and increase efficiency.